Coding N Concepts
 JavaScript Debugging Tips and Tricks
In this tutorial, we’ll learn plenty of tips and tricks for debugging JavaScript code using Chrome DevTool, different ways of logging to the console using console APIs, and much more…
Say No to alerts
alert("I will pop up in browser");
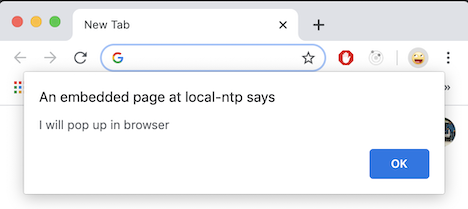
When we use alert() for debugging value, it pops up in the browser which is blocking and annoying. Try to avoid them as there are alternate ways available for debugging, we’ll look at them subsequently.
Browser as Debugger
Most of the modern browsers such as Chrome, Firefox, Edge, Opera, and Safari has built-in support for JavaScript debugging. Chrome as the debugger is generally the first choice among developers.
Chrome Developer Tool
To open DevTool from Chrome’s main menu, select More tools ➞ Developer tools.
| Shortcut keys | Mac | Windows, Linux, Chrome OS |
|---|---|---|
| Elements Tab | Command+Option+C | Control+Shift+C |
| Console Tab | Command+Option+J | Control+Shift+J |
| Sources Tab | Command+Option+I | Control+Shift+I |
Chrome Developer Tool
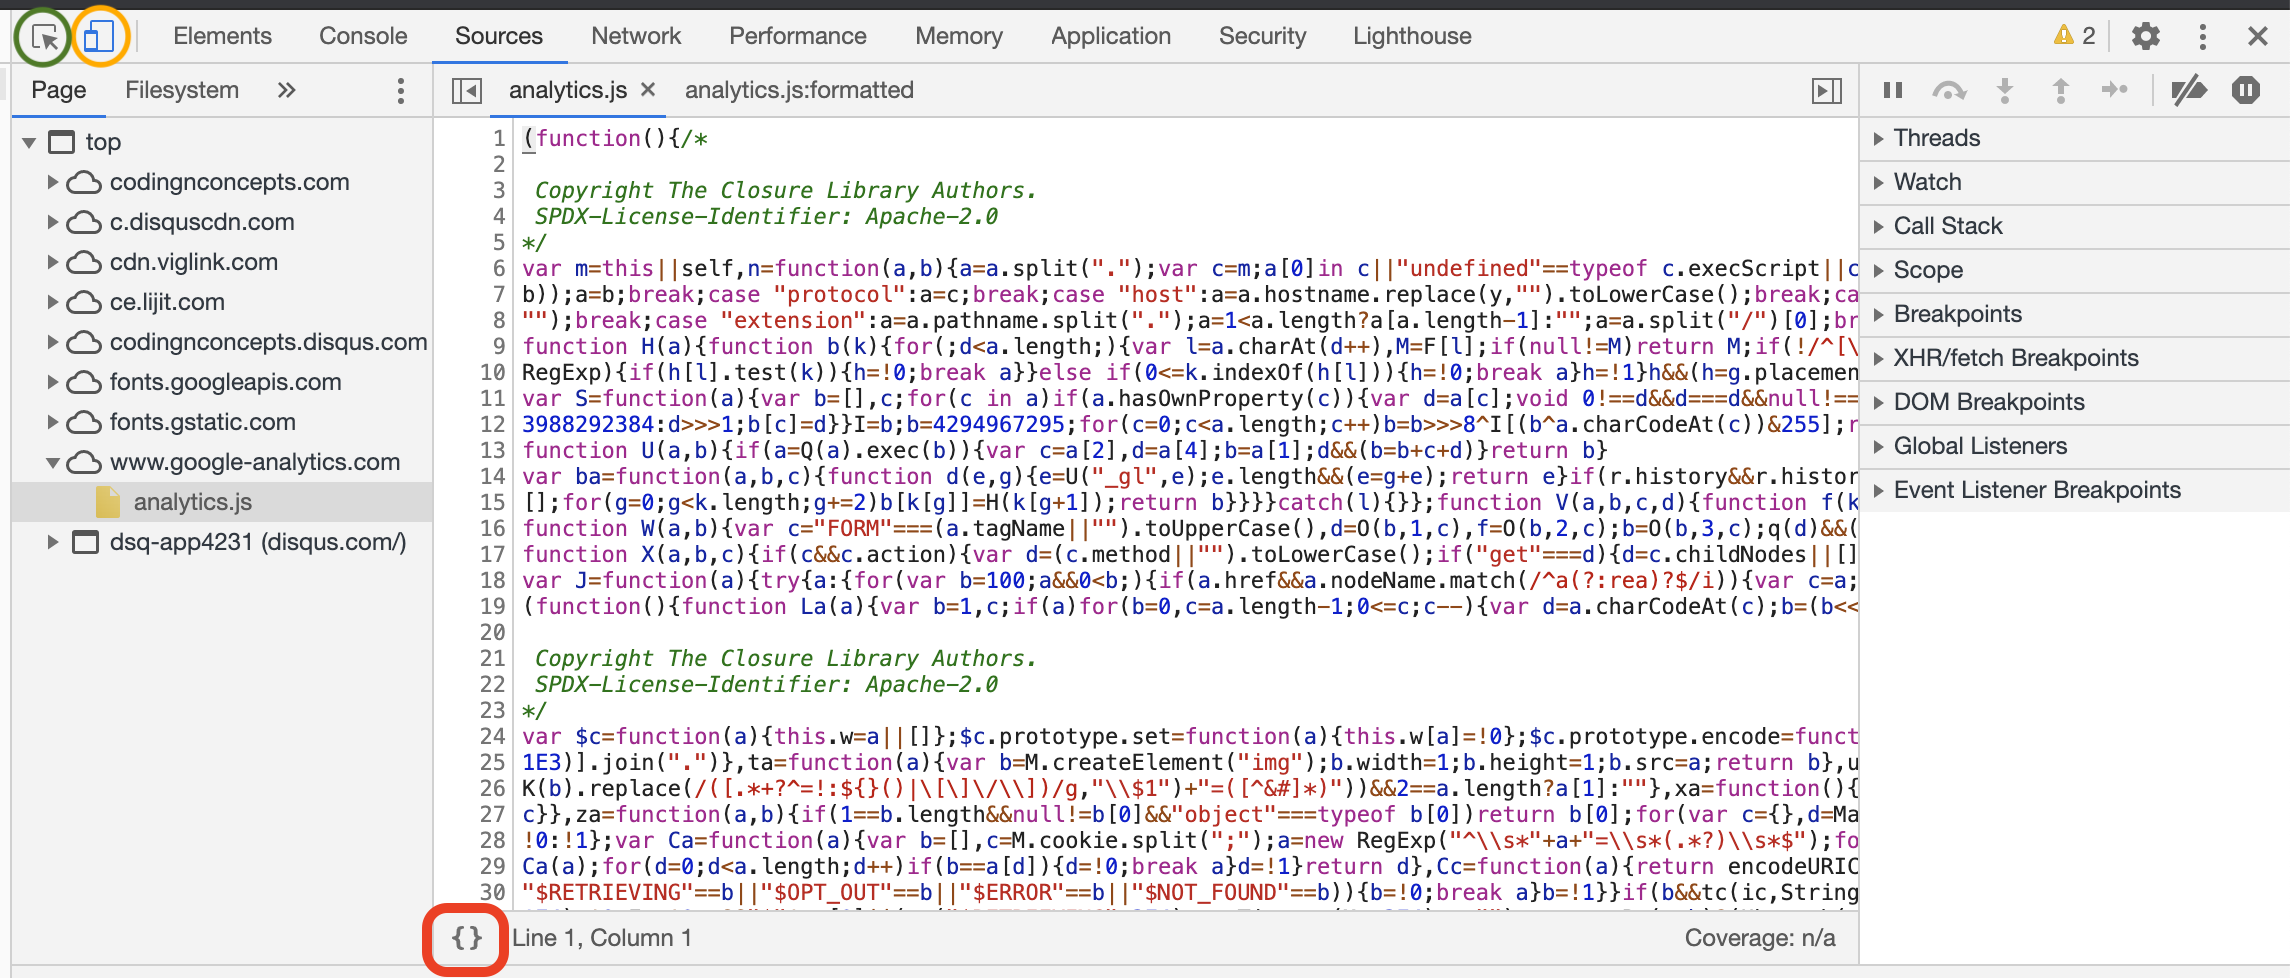
Some of the most frequently used icons of Chrome DevTools are:-
- Use Inspect icon
⬉to select an element in the page and inspect its DOM position in Elements Tab. You can update or delete a DOM element, inspect the CSS applied on DOM element, and much more in Elements Tab. - Use Device icon
⍇to check the responsiveness of the website. It adds an additional toolbar on your browser page where you can simulate viewport for different devices, for e.g. mobile phones (such as iPhone, Samsung Galaxy, Nexus, LG, Nokia, Blackberry, etc), tablets (such as iPad etc) and laptops (with or without touch). - You can see all JavaScript source code that renders the page, under Sources Tab. Generally source files are minified and it is difficult to understand them and apply breakpoints. Use Format Icon
{}to format these minified files in human readable format.
Line-of-code Breakpoint
You can use breakpoint to pause your JavaScript code in browser. The most well known type of breakpoint is line-of-code.
To set a line-of-code breakpoint in DevTools:
- Click on Sources tab.
- Open the file and go to the line of code you want to debug.
- You will see line number column to the left of code. Click on it. An icon appears beside line number to indicate that the breakpoint is set.
- Click again on same line number if you want to remove breakpoint. Icon disappears.
Please note that the breakpoint icon in DevTool may look different depending upon chrome version and OS (windows or MacOS)
Sometime line-of-code breakpoints can be inefficient to set, especially if you don’t know exactly where to look, or if you are working with a large codebase. You can save your time when debugging by knowing how and when to use the other types of breakpoints.
| Breakpoint Type | Use This When You Want To Pause… |
|---|---|
| Line-of-code | On an exact line of code. |
| Conditional line-of-code | On an exact line of code, but only when some other condition is true. |
| DOM | On the code that changes or removes a specific DOM node, or its children. |
| XHR | On the XHR send() or fetch() method When the request URL contains a string pattern. |
| Event listener | On the code that runs after an event, such as click, is fired. |
| Exception | On the line of code that is throwing a caught or uncaught exception. |
| Function | Whenever a specific function is called. |
Set Breakpoint from code using ‘debugger’ statement
When debugger mode is on in the browser and the code execution reaches to debugger; statement, it pause on that line just like line-of-code breakpoint.
The debugger statement is quite useful when you want to debug a certain part of your code in browser. Normally you find the buggy code in browser developer tool and set a breakpoint to debug. Sometimes it is not easy to find the code in browser, in that case, you can insert debugger; statement in your source code.
function hello(name) {
  let phrase = `Hello, ${name}!`;

  debugger;  // <-- the debugger pause on this line

  say(phrase);
}
Conditional Breakpoint
You can use a conditional line-of-code breakpoint when you know the exact line of code that you need to investigate, but you want to pause only when some other condition is true.
To set a conditional line-of-code breakpoint:
- Click the Sources tab.
- Open the file and go to the line of code you want to debug.
- You will see line number column to the left of code. Right-click it.
- Select Edit breakpoint.., A dialog displays underneath the line of code.
- Enter your condition in the dialog.
- Press Enter to activate the breakpoint.
You see that icon for conditional breakpoint is different from simple line-of-code breakpoint. Breakpoint icon in DevTool may look different depending upon chrome version and OS (windows or MacOS)
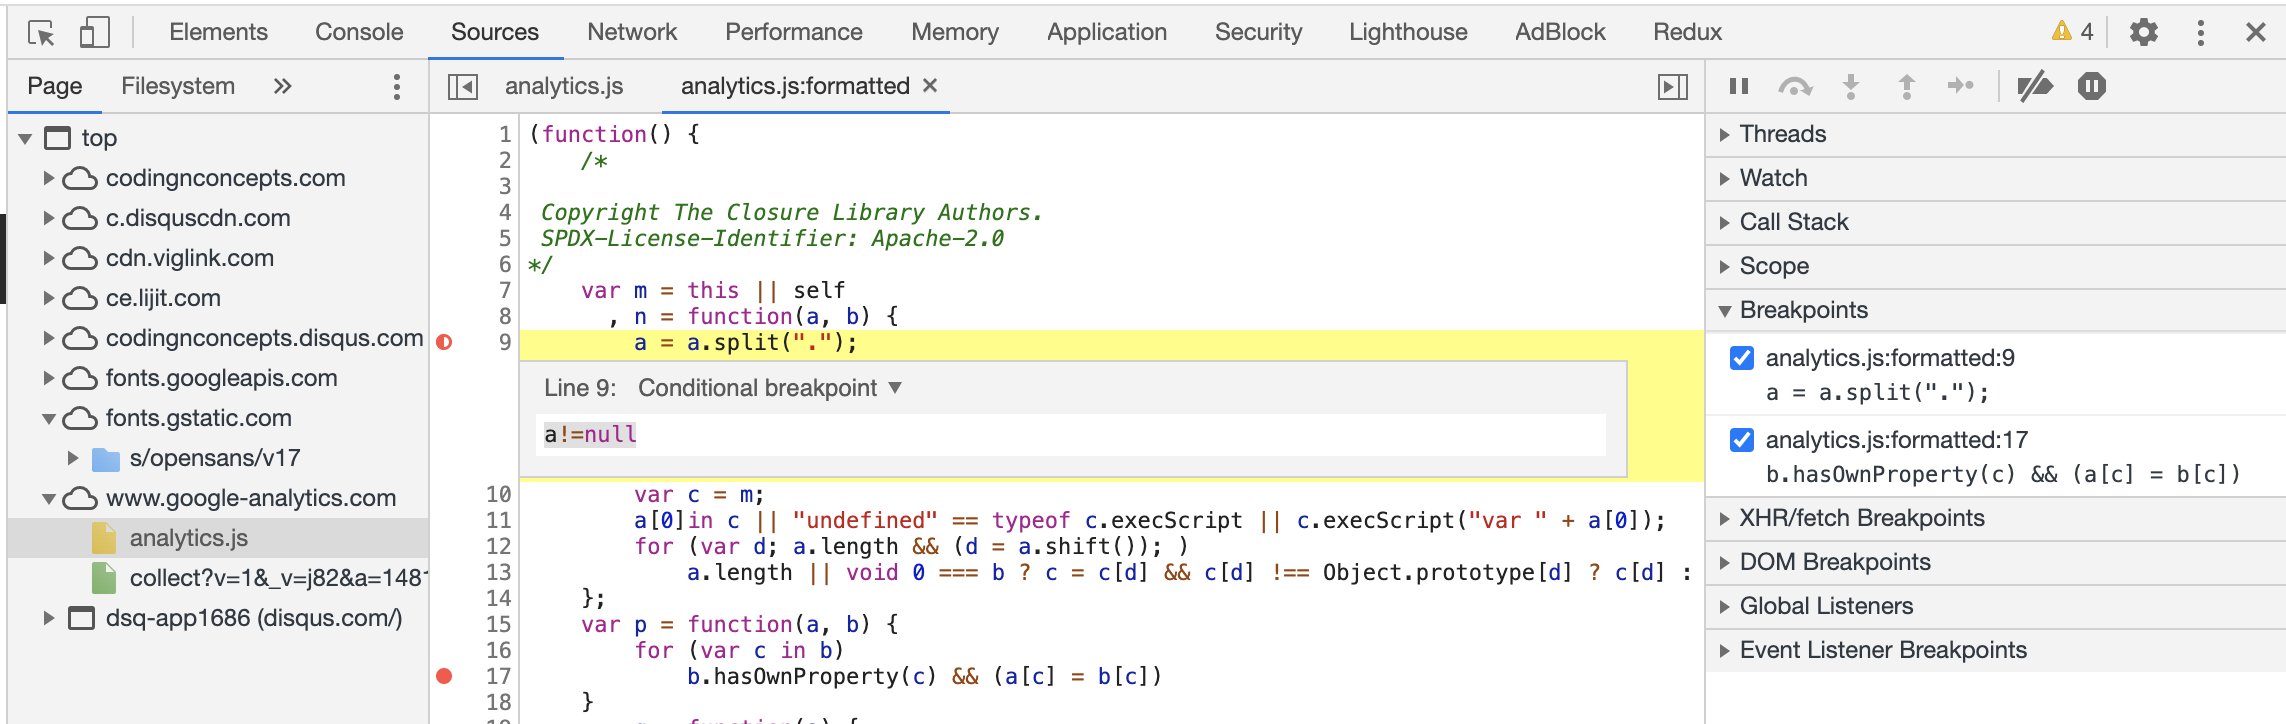
Chrome DevTool Conditional Breakpoint
DOM Change Breakpoint
Use a DOM change breakpoint when you want to pause on the code that changes a DOM node or its children.
To set a DOM change breakpoint:
- Click the Elements tab.
- Go the element that you want to set the breakpoint on.
- Right-click the element.
- Hover over Break on then select Subtree modifications, Attribute modifications, or Node removal.
Types of DOM change breakpoints
- Subtree modifications: Triggered when a child of the currently-selected node is removed or added, or the contents of a child are changed. Not triggered on child node attribute changes, or on any changes to the currently-selected node.
- Attributes modifications: Triggered when an attribute is added or removed on the currently-selected node, or when an attribute value changes.
- Node Removal: Triggered when the currently-selected node is removed.
XHR/Fetch Breakpoint
If you encounter an error in AJAX request and you are not able to identify the code which is submitting this request, then XHR breakpoint is very useful to quickly find the AJAX source code.
XHR breakpoint pause the execution of code when the request URL of an AJAX request contains a specified string. XHR breakpoint is supported for AJAX send() and fetch() methods.
To set an XHR breakpoint:
- Click the Sources tab.
- Expand the XHR Breakpoints pane.
- Click Add breakpoint.
- Enter the string which you want to break on. DevTools pauses when this string is present anywhere in an XHR’s request URL.
- Press Enter to confirm.
Event listener Breakpoint
Use event listener breakpoints when you want to pause on the event listener code that runs after an event is fired. You can select specific events, such as click under mouse events, or all events, such as cut, copy, paste under clipboard category.
To turn on event listener breakpoint:
- Click the Sources tab.
- Expand the Event Listener Breakpoints pane. DevTools shows a list of event categories, such as Animation, Canvas, Clipboard, Mouse, etc.
- Either check ☑ category to include all events under that category, or expand the category and check ☑ a specific event.
Exception Breakpoint
The Chrome Developer Tools allows you to pause execution of your JavaScript code upon throwing a caught or uncaught exception. This is particularly useful when your code is not throwing error and failing silently. This makes it possible for you to inspect the state of your application at the time when the Error object was created.
To turn on exception breakpoint:
- Click the Sources tab.
- Click Pause on exceptions icon. It turns blue when enabled.
- Check ☑ Pause on uncaught exceptions if you want to pause execution on caught exceptions as well.
- Remember to turn them off when done.
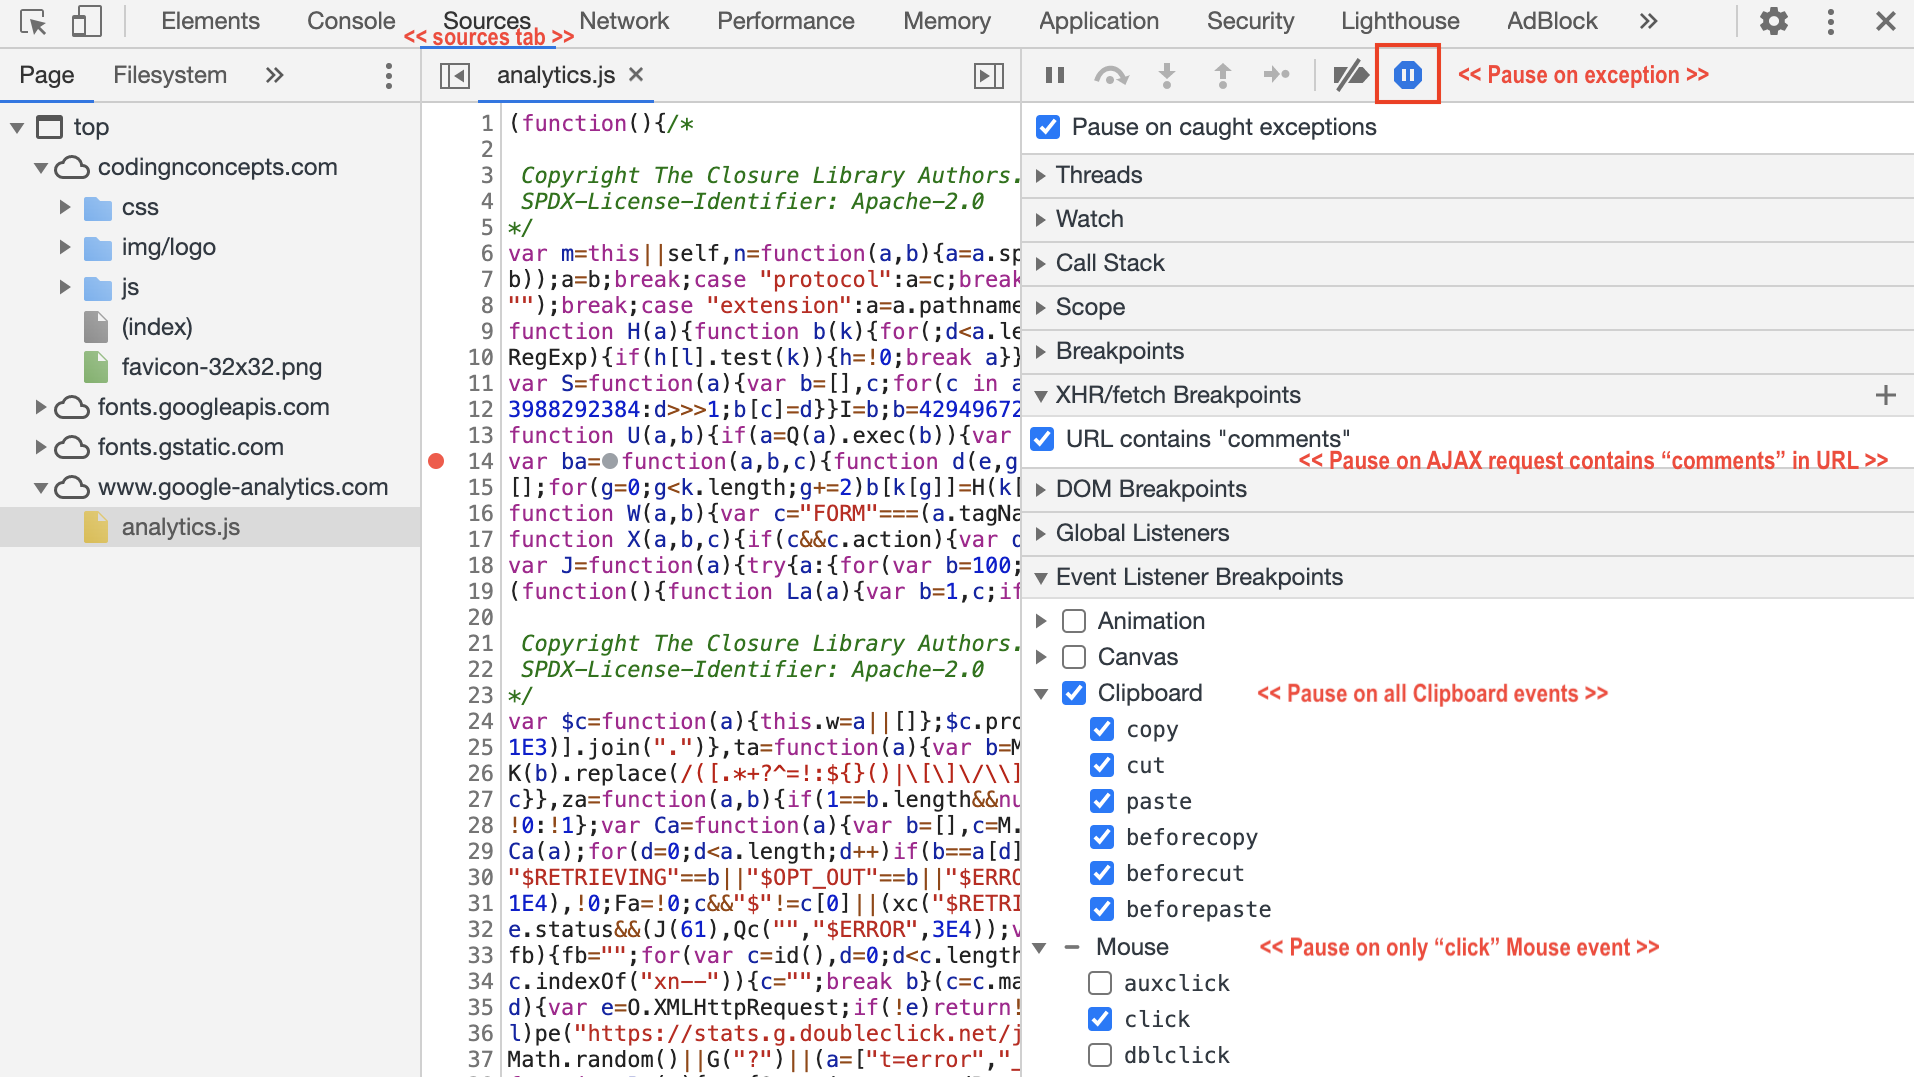
Chrome DevTool XHR, Event Listener and Exception Breakpoints
Function Breakpoint
Call debug(functionName), where functionName is the function you want to debug, when you want to pause whenever a specific function is called. You can insert debug() into your code (like a console.log() statement) or call it from the DevTools Console. debug() is equivalent to setting a line-of-code breakpoint on the first line of the function.
Make sure the target function is in scope. DevTools throws a ReferenceError if the function you want to debug is not in scope.
function sum(a, b) {
  let result = a + b; // DevTools pauses on this line.
  return result;
}
debug(sum); // Pass the function object, not a string.
sum();
Blackbox Script files
When you debug your application code in Chrome DevTool and step through your code line-by-line, the debugger sometimes jumps into a source file that’s not your focus (such as a third-party JS library). I’m sure you’ve experienced the annoyance of stepping through the library code before getting back to your own application code.
The Chrome DevTool provides an ability to blackbox JavaScript file(s) so that debugger will not jump into those files and ignore them when stepping through code you’re debugging.
What happens when you blackbox a script?
- Exceptions thrown from library code will not pause (if Pause on exceptions is enabled),
- Stepping into/out/over bypasses the library code,
- Event listener breakpoints don’t break in library code,
- The debugger will not pause on any breakpoints set in library code.
The end result is you are debugging your application code instead of third party resources. To blackbox JavaScript files:
- Click on Main Menu > Settings icon OR use
F1shortcut key to open settings - Click on Blackboxing menu item.
- Click on Add Pattern… button.
- Enter file name or pattern in text box and click Add button.
- Check ☑ Blackbox content script to enable blackboxing.
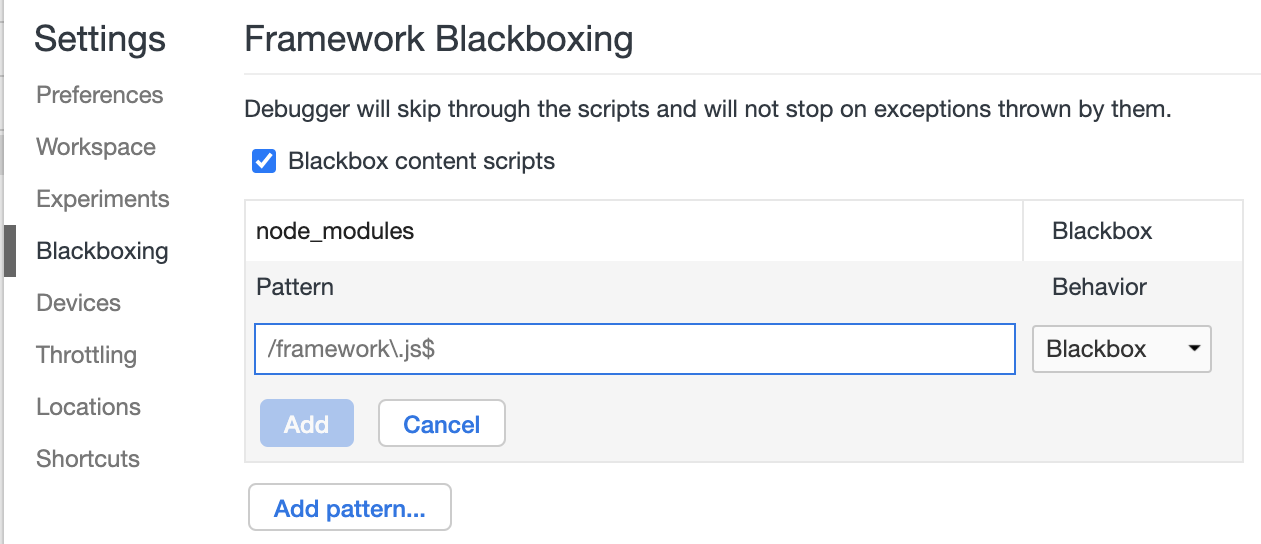
Chrome DevTool Blackbox Script
Snippets
Generally we use browser console to execute and test some code snippets. Sometime, we need to test same code again and again. The Chrome DevTools provides the ability to save code snippets for future use.
To save your code snippet:
- Click the Sources tab.
- In the left panel of Sources Tab, Click on the Snippets sub-tab.
- Click on + New Snippet to create a new file to save your code snippet.
- When you open a snippet code. There are icons to format and execute your code.
You can use snippets to store your frequently used debugging code scripts, made by you or other developers. Paul Irish has written some useful snippets - stopBefore.js, Grep.js which you can copy in your DevTool snippets. Snippets are accessible from console. Let’s go through them:-
- The storeBefore.js snippet allows to setup a breakpoint that is triggered just before a certain function is called. For example, this will trigger a breakpoint just before the
document.getElementByIdfunction is called:stopBefore(document, 'getElementById') - The grep.js snippet allows searching an object and its prototypical chain for properties that match a given search criteria. For example this instruction will search for all properties matching get in the document object:
grep(document, 'get'); - The debugAccess.js snippet allows to trigger a breakpoint when a given property is accessed. For example this will trigger a breakpoint each time document.cookie is called:
debugAccess(document, 'cookie');
Print Multiple Values
Most of the developers use console.log() for debugging values in browser console. It is a king of debugging and this solves most of your debugging problems.
The thing you might not know is, console.log() can print multiple values by providing comma-separated values so you don’t need to concat values yourself.
Each comma "," add a space between values.
let x = 1;
console.log('x =', x);

let y = "hello";
let fruits = ['apple', 'banana', 'mango'];
var obj = {a: 1, b: 2};

console.log('x =', x, 'y =', y, 'fruits =', fruits, 'obj =', obj);
Output
x = 1
x = 1 y = hello fruits = (3) ["apple", "banana", "mango"] obj = {a: 1, b: 2}
You can also use Template Literal to combining multiple values in single string like this
console.log(`x = ${x}, y = ${y}, fruits = ${fruits}, obj = ${obj}`);
Avoid logging Object Reference
Don’t use
console.log(obj), useconsole.log(JSON.parse(JSON.stringify(obj)))instead.
When you log an array (or object) using console.log() and update it afterward. Many browsers show you the latest state of the array (or object) which might be misleading.
Logging using console.log(JSON.parse(JSON.stringify(obj))) make sure, you are printing a copy of array (or object) which will log the exact state at the time of printing.
Let’s understand this from below array example,
let fruits =  ['apple', 'banana', 'mango'];

console.log(fruits);
console.log(JSON.parse(JSON.stringify(fruits))); //makes a copy of it

fruits.push('grapes');
Output
▼ (3) ["apple", "banana", "mango"]
   0: "apple"
   1: "banana"
   2: "mango"
   3: "grapes"
   length: 4
 ➤ __proto__: Array(0)


▼ (3) ["apple", "banana", "mango"]
   0: "apple"
   1: "banana"
   2: "mango"
   length: 3
 ➤ __proto__: Array(0)
We see that console.log() showing the latest state of array with length 4 whereas its length was 3 at the time of logging.
Let’s also look at object example,
let person =  { name: 'adam', age: 21, gender: 'male' };

console.log(person);
console.log(JSON.parse(JSON.stringify(person))); //makes a copy of it

person.married = 'NO';
Output
▼ {name: "adam", age: 21, gender: "male"}
   age: 21
   gender: "male"
   married: "NO"
   name: "adam"
 ➤ __proto__: Object

▼ {name: "adam", age: 21, gender: "male"}
   age: 21
   gender: "male"
   name: "adam"
 ➤ __proto__: Object
We see that console.log() showing the latest state of object including married field which was missing at the time of logging.
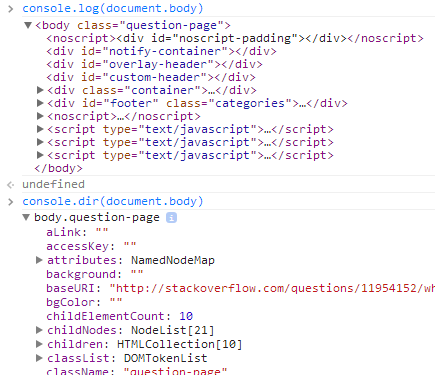
Print DOM element in JSON format
DOM elements are printed as HTML elements tree structure using console.log(). Instead, we can use console.dir() to see DOM elements in JSON like tree structure.
console.log(document.body);
console.dir(document.body);
Print Constructor function’s Prototype Methods
The console.dir() is quite useful to print constructor function’s internal properties such as prototype methods.
We see in below example that console.log() just print the name of constructor function whereas, using console.dir(), we’re able to see all prototype methods of Array function.
console.log(Array);
console.dir(Array);
Output
ƒ Array() { [native code] }

▼ ƒ Array()
      arguments: (...)
      caller: (...)
      length: 1
      name: "Array"
    ▼ prototype: ƒ ()
          length: 0
        ➤ constructor: ƒ Array()
        ➤ concat: ƒ concat()
        ➤ find: ƒ find()
        ➤ findIndex: ƒ findIndex()
        ➤ lastIndexOf: ƒ lastIndexOf()
        ➤ pop: ƒ pop()
        ➤ push: ƒ push()
        ➤ reverse: ƒ reverse()
        ➤ slice: ƒ slice()
        ➤ sort: ƒ sort()
        ➤ splice: ƒ splice()
        ➤ includes: ƒ includes()
        ➤ indexOf: ƒ indexOf()
        ➤ join: ƒ join()
        ➤ toString: ƒ toString()
        ...
Print Function’s Closure
The console.dir() is quite useful to print function’s internal properties such as scopes and closures.
We see in below example that console.log() just print the function’s signature, using console.dir(), we’re able to see the prototype methods, scopes and most importantly closures of the function.
var outerFunc  = function(c){
  var a = 1;
  var innerFunc = function(d) {
    var b = 2;
      var innerMostFunc = function(e) {
    return a + b + c + d + e;
    }
    return innerMostFunc;
  }
  return innerFunc;
}

// print innerMostFunc
console.log(outerFunc(3)(4));
console.dir(outerFunc(3)(4));
Output
ƒ (e) {
    return a + b + c + d + e;
    }

▼ ƒ innerMostFunc(c)
    length: 1
    name: "innerMostFunc"
    arguments: null
    caller: null
  ➤ prototype: {constructor: ƒ}
  ➤ __proto__: ƒ ()
    [[FunctionLocation]]:
  ▼ [[Scopes]]: Scopes[3]
    ➤ 0: Closure (innerFunc) {d: 4, b: 2}
    ➤ 1: Closure (outerFunc) {c: 3, a: 1}
    ➤ 2: Global {parent: Window, opener: null, top: Window, length: 1, frames: Window, …}
Print Object’s internal properties
Some of the browsers print a stringify version of object when use console.log() whereas prints object JSON tree when use console.dir(). There is not much difference in printing in advance browsers such as chrome where both methods print object JSON tree.
var obj = {a: 1, b: 2};

console.log(obj);
console.dir(obj);
We see that nothing much different when print object using both methods in chrome browser,
Output
▼ {a: 1, b: 2}
  a: 1
  b: 2
➤ __proto__: Object

▼ Object
  a: 1
  b: 2
➤ __proto__: Object
Print Objects as Table
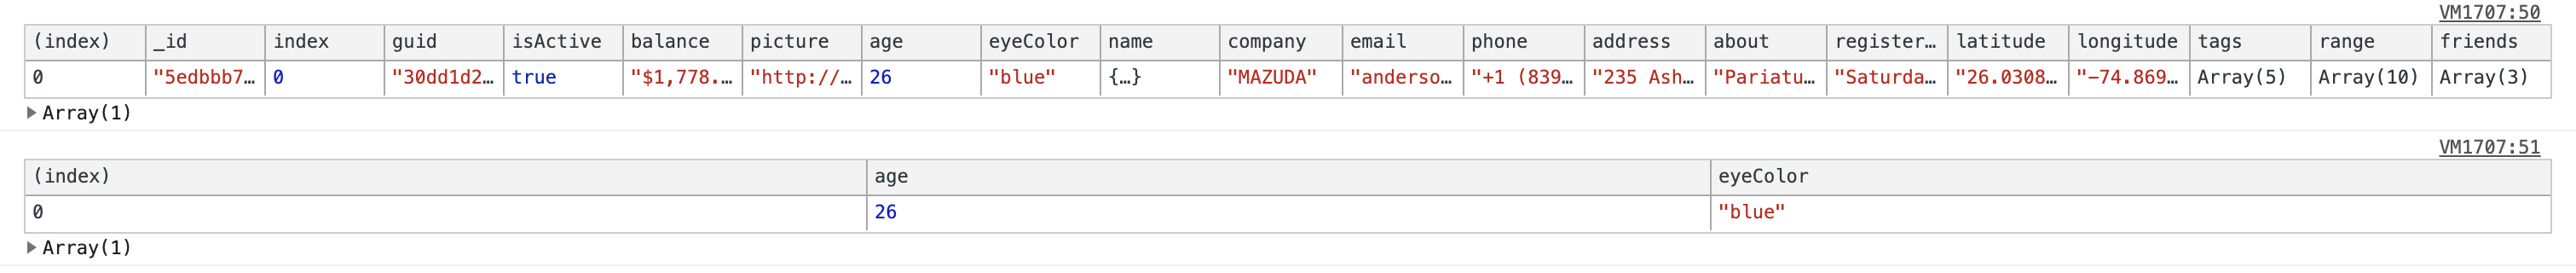
The console.table() method is quite useful to print a large set of data in tabular format to visualize it easily. This method also provides the ability to print a few fields out of those large data sets. When rendered in browser as a table, browser provides the ability to sort the columns of the table.
Let’s look at the example where we are logging a large JSON in tabular format,
var personDetails = [
  {
    "_id": "5edbbb78633118f455e877fb",
    "index": 0,
    "guid": "30dd1d2c-5083-4165-8580-5ae734cd0d12",
    "isActive": true,
    "balance": "$1,778.03",
    "picture": "http://placehold.it/32x32",
    "age": 26,
    "eyeColor": "blue",
    "name": {
      "first": "Anderson",
      "last": "Sargent"
    },
    "company": "MAZUDA",
    "email": "anderson.sargent@mazuda.com",
    "phone": "+1 (839) 437-3851",
    "address": "235 Ashland Place, Chautauqua, Minnesota, 3487",
    "about": "Pariatur nisi cillum culpa aliquip mollit veniam. Laboris in minim non dolor ut deserunt ex sit occaecat irure consequat pariatur esse. Cillum velit dolore enim non enim ipsum aliqua veniam fugiat adipisicing magna mollit occaecat.",
    "registered": "Saturday, April 8, 2017 3:02 AM",
    "latitude": "26.03084",
    "longitude": "-74.869342",
    "tags": [
      "labore",
      "nulla",
      "ea",
      "qui",
      "sunt"
    ],
    "range": [0, 1, 2, 3, 4, 5, 6, 7, 8, 9],
    "friends": [
      {
        "id": 0,
        "name": "Coleman Nunez"
      },
      {
        "id": 1,
        "name": "Foley Curry"
      },
      {
        "id": 2,
        "name": "Kara Glass"
      }
    ],
    "greeting": "Hello, Anderson! You have 5 unread messages.",
    "favoriteFruit": "apple"
  }
]

console.table(personDetails);
console.table(personDetails, ["age", "eyeColor"]);  // print few fields
The below output in tabular format is from chrome browser,
Also learn more about console.table() usage in JavaScript
Print Time taken for Code Execution
You can print time taken by a code execution by using console.time() before and console.timeEnd() after that particular piece of code. Few pointers:-
- console.time() and console.timeEnd() methods should have same labels.
- You can also set up multiple timers by assigning different labels to the method.
- console.time() and console.timeEnd() are part of the Console API (just like console.log())
Let’s see how it works:
console.time('Timer1');
console.time('Timer2');

var items = [];

for(var i = 0; i < 100000; i++){
   items.push({index: i});
}

console.timeEnd('Timer1');

for(var j = 0; j < 100000; j++){
   items.push({index: j});
}

console.timeEnd('Timer2');
Output
Timer1: 13.088134765625ms
Timer2: 26.070517578125ms
Print Stack trace of Method Execution
You can use console.trace() to print a stack trace of method execution flow to the console. Few pointers:-
- console.trace() is compatible with the snippets feature of Chrome DevTools.
- console.trace() is part of the Console API (just like console.log())
Let’s see how it works:
1  const first = () => { second(); };
2  const second = () => { third(); };
3  const third = () => { fourth(); };
4  const fourth = () => { console.trace("The trace"); };
5  first();
You get @ file_name:line_number in console output which you can click on to navigate to the source.
Output
▼ The trace
  fourth        @ test:4
  third	        @ test:3
  second        @ test:2
  first	        @ test:1
  (anonymous)   @ test:5
Use a Unit Testing Framework
There are many third-party unit-testing framework for JavaScript available with their own philosophy and syntax. Here are most widely used JavaScript testing frameworks:-
- Mocha is feature-rich framework running on Node.js and in the browser, making asynchronous testing simple and fun. Mocha tests run serially, allowing for flexible and accurate reporting, while mapping uncaught exceptions to the correct test cases.
- JEST is popular framework maintained by Facebook. It is a preferred framework for the React based applications as it requires zero configuration. It works great with projects using Babel, TypeScript, Node, React, Angular, and Vue.
- Jasmine is a behavior-driven testing framework. It has no external dependencies. It does not require a DOM. And it has a clean, obvious syntax so that you can easily write tests.
- QUnit is a powerful, easy-to-use JavaScript unit testing framework. It’s used by the jQuery, jQuery UI and jQuery Mobile projects and is capable of testing any generic JavaScript code
Thanks for reading till the end. I hope this tutorial would have helped you to find some useful tips for debugging and logging to the console, which you’d not known before.
Reference: